Most board decks are too long, too late and in a different order every quarter. Directors spend the first half of the meeting finding the numbers and the second half asking questions the deck should have answered. A fixed board deck template solves most of that.
A good board deck has one job: get the board to the decisions you need, with the facts they need, in the time you have. Twelve slides is enough. The rest goes in the appendix.
1. The board deck template: 12 slides, in the same order, every quarter
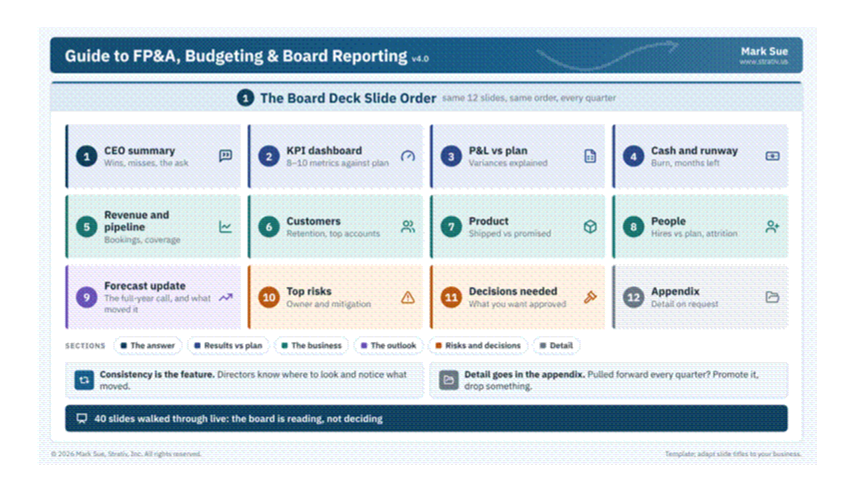
Consistency is the feature. When the order never changes, directors know where to look, and they notice what moved.
1. CEO summary: wins, misses, the ask
2. KPI dashboard: 8-10 metrics against plan
3. P&L vs plan: variances explained
4. Cash and runway: burn, months left
5. Revenue and pipeline: bookings, coverage
6. Customers: retention, top accounts
7. Product: shipped vs promised
8. People: hires vs plan, attrition
9. Forecast update: the full-year call, and what moved it
10. Top risks: owner and mitigation
11. Decisions needed: what you want approved
12. Appendix: detail on request
If your deck is 40 slides walked through live, the board is reading. They are not deciding.
Twelve slides is not a word limit. Detail still matters. It belongs in the appendix, where a director who wants the cohort table or the department-level spend can find it without the whole room sitting through it. If the same appendix slide gets pulled forward every quarter, promote it and drop something else. The main deck stays at twelve.
2. Lead the board deck with the answer
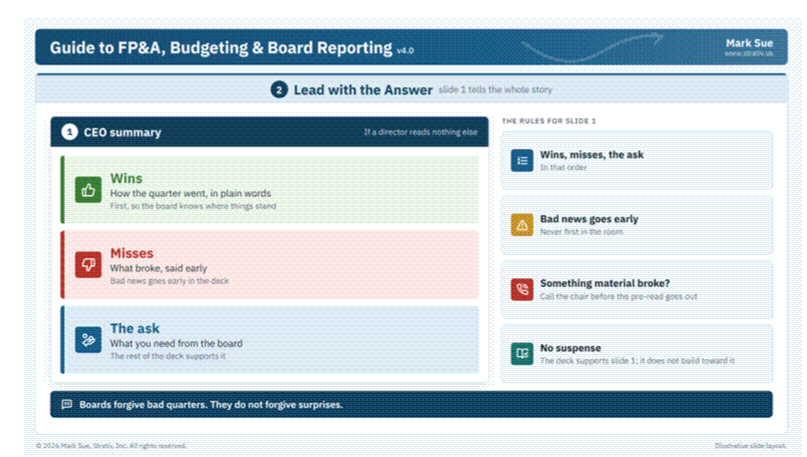
Slide 1 should tell a director who reads nothing else how the quarter went and what you need from them. Wins, misses, the ask, in that order. The rest of the deck supports slide 1. It does not build suspense toward it.
Bad news goes early in the deck. It never appears for the first time in the room. If something material broke, call the chair before the pre-read goes out. Boards forgive bad quarters. They do not forgive surprises.
3. Build a board KPI dashboard directors actually read
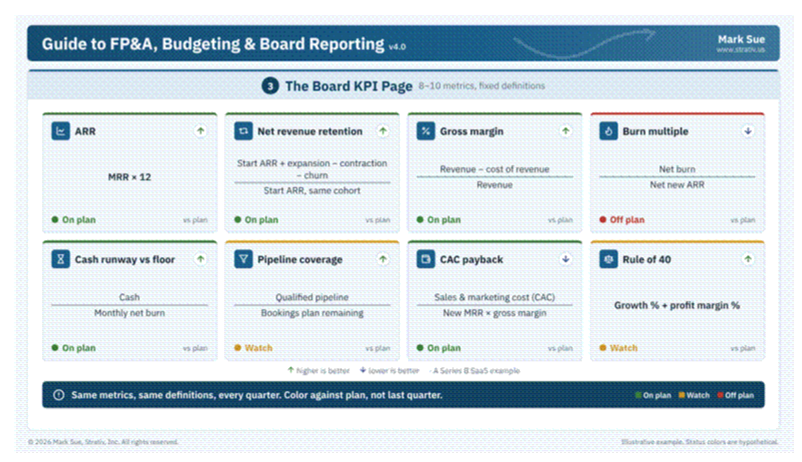
Pick 8-10 metrics and keep the definitions fixed. A Series B SaaS company might show ARR, net revenue retention, gross margin, burn multiple, cash runway against a floor, pipeline coverage, CAC payback and the Rule of 40.
Two rules make this page work:
• Same metrics, same definitions, every quarter. Fixed definitions are what let directors compare one quarter to the next.
• Status color is against plan, not against last quarter. Green means on plan. It does not mean "better than before."
If the company claims R&D tax credits, add the credit-to-QRE ratio here too. Our post on non-dilutive capital covers the benchmarks.
4. Variance analysis: explain budget variances, don't just report them
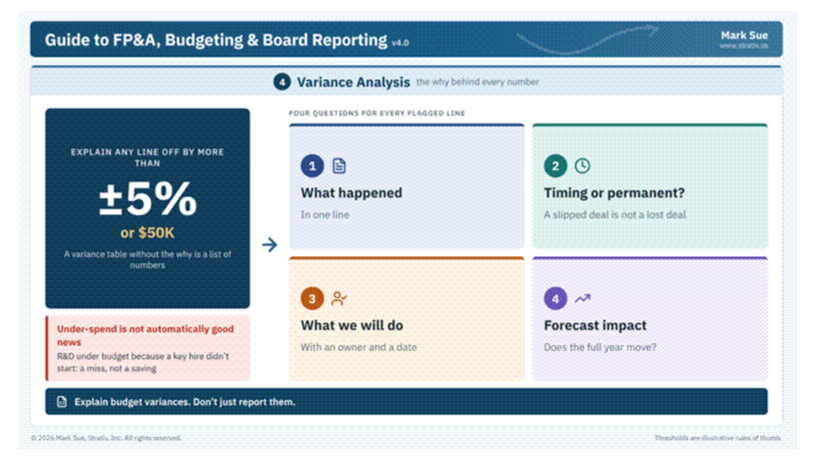
A variance table without the why is a list of numbers. Explain any line that is off by more than ±5% or $50K, and answer four questions for each:
1. What happened, in one line
2. Timing or permanent? A slipped deal is not a lost deal.
3. What we will do, with an owner and a date
4. Forecast impact: does the full year move?
Under-spend is not automatically good news. If R&D came in under budget because a key hire didn't start, that is a miss, not a saving.
5. Put the board discussion on slide 11, not slide 3
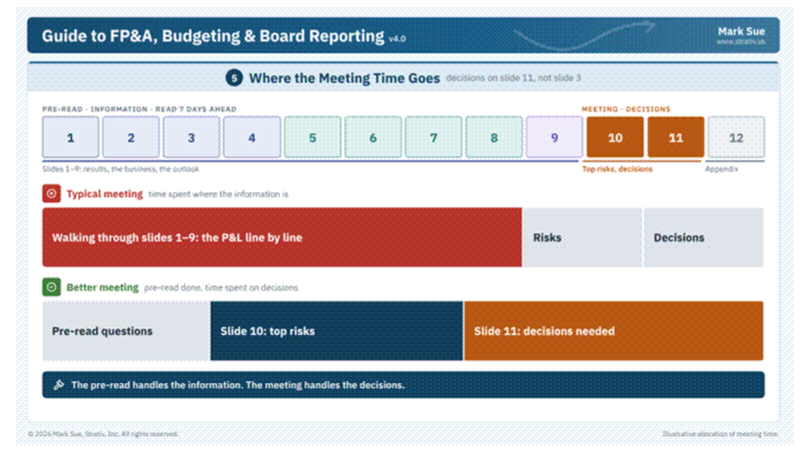
Most board time gets spent on the slides at the front, where the information is. That is backwards. The pre-read should handle the information. The meeting should handle the decisions.
That only works if directors have read the deck. Send the 12-slide board pre-read seven days before the meeting. Then spend the meeting on top risks and decisions needed, not on walking through the P&L line by line.
The 12-slide order already supports this. Top risks and decisions needed sit at slides 10 and 11, after the information directors have already read. Get there with most of the meeting still ahead of you.
6. Run the close-to-board calendar backward from the meeting
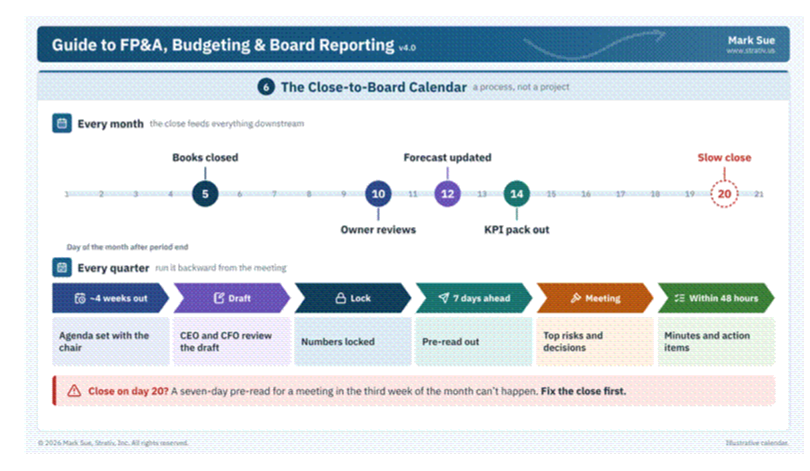
A board deck is the last step of the board reporting process, not a project that starts a week before.
• Every month: close the books by day 5, owner reviews by day 10, forecast updated by day 12, KPI pack out by day 14.
• Every quarter: set the agenda with the chair about four weeks out, CEO and CFO review the draft, numbers locked, pre-read out seven days ahead, and minutes and action items within 48 hours after.
If the monthly close is slow, the board deck is late. A company that closes on day 20 cannot send a pre-read seven days before a meeting held in the third week of the month.
Fix it: fix the close first. Everything downstream, including the board deck, runs on it.
A better board meeting starts weeks earlier
Same slides, same order, the answer first, variances explained, decisions at the end, and a calendar that gets the pre-read out on time. None of it happens in the week before the meeting.
A shorter deck isn't less work. It's the work done before the meeting.
Board deck FAQ
How many slides should a board deck have? Twelve: CEO summary, KPI dashboard, P&L vs plan, cash and runway, revenue and pipeline, customers, product, people, forecast update, top risks, decisions needed, and an appendix for detail on request.
What should be on the board KPI page? 8-10 metrics with fixed definitions, colored against plan. A Series B SaaS company might show ARR, net revenue retention, gross margin, burn multiple, runway against a floor, pipeline coverage, CAC payback and the Rule of 40.
Which budget variances should you explain to the board? Any line off by more than ±5% or $50K. For each, say what happened, whether it is timing or permanent, what you will do with an owner and a date, and whether the full-year forecast moves.
When should the board pre-read go out? Seven days before the meeting, so the meeting can be spent on top risks and decisions rather than walking through the P&L.
What is a close-to-board calendar? The reporting schedule that runs backward from the board meeting: books closed by day 5, owner reviews by day 10, forecast updated by day 12 and the KPI pack out by day 14 each month, with the pre-read out seven days before the meeting and minutes within 48 hours after.
The Guide to FP&A, Budgeting & Board Reporting covers the FP&A operating cycle, the annual budget, driver-based models, rolling forecasts, variance analysis, the close-to-board calendar and the 12-slide board deck on one page.